How to: Sniff Wireless Packets with
Wireshark
by
Jim Geier
Back to Tutorials
Wireshark (formally Ethereal) is freely-available software that interfaces with an 802.11 client card and passively captures (“sniffs”) 802.11 packets being transmitted within a wireless LAN.
Installing Wireshark
Wireshark software is easy to install. Simply go to http://www.wireshark.org/download.html, download the software for your applicable operating system, and perform the installation.
A problem you’ll likely run into is that Wireshark may not display any packets after starting a capture using your existing 802.11 client card, especially if running in Windows. The issue is that many of the 802.11 cards don’t support promiscuous mode. In this case, you can try turning promiscuous mode off (from inside Wireshark), but you’ll only see (at best) packets being sent to and from the computer running Wireshark.
If you have trouble getting Wireshark working with existing client cards, then consider purchasing AirPcap, which is a USB-based 802.11 radio designed to work effectively with Wireshark. It comes with drivers tuned to Wireshark and operates very well. An external antenna is also included with AirPcap, which increases the listening ability of the tool. For MAC users, you should be able to interface Wireshark directly with your integrated 802.11 radio.
Capturing packets
Before capturing packets, configure Wireshark to interface with an 802.11 client device; otherwise, you’ll get an alert “No capture interface selected!” when starting a packet capture. To select an interface, click the Capture menu, choose Options, and select the appropriate interface.
Be certain to monitor the correct RF channel. For example, if the wireless network is set to channel 1 for the traffic you’re interested in, then configure Wireshark to monitor channel 1. To do this, click the Capture menu, choose Options, and click Wireless Settings. The menu Advanced Wireless Settings will appear where you can change the channel.
Consider filtering the packet capture to reduce clutter when analyzing packet traces. For example, you may be troubleshooting a particular client device connecting to the network. In this case, you can set a filter that excludes all packets except those associated with the IP address of the client you’re troubleshooting. To set a filter, click the Capture menu, choose Options, and click Capture Filter. The Wireshark Capture Filter window will appear where you can set various filters.
To start the packet capturing process, click the Capture menu and choose Start. Wireshark will continue capturing and displaying packets until the capture buffer fills up. The buffer is 1 Mbytes by default. This size is generally good enough, but to change it click the Capture menu, choose Options, and adjust the Buffer size value accordingly. When you’re done capturing packets, click the Capture menu and choose Stop.
Alternatively, you can set the capture run length (in packets or minutes), and the capture will automatically stop when that length has been met. You’ll be prompted to save the capture for later viewing.
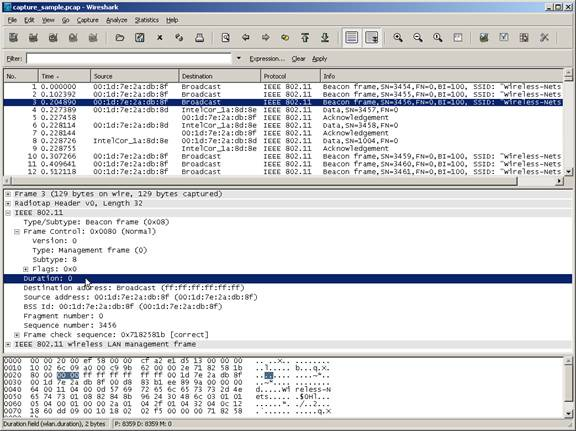
The packet capture will display the details of each packet as they were transmitted over the wireless LAN. Figure 1 is a screenshot of a sample packet capture window. The top panel of the window identifies each packet’s source and destination nodes, protocol implemented, and information about each packet. You can select a specific packet to display more details. The one selected in Figure 1, packet 3, is an 802.11 beacon frame. The middle panel displays information about this packet, and you can choose a specific field of the packet (such as Duration field shown in the figure), and the contents of that field are displayed in hex and ASCII format in the bottom panel. As a result, you’re able to analyze the flow and view each field (including data field payloads) of all packets.

Figure 1. Wireshark sample capture.
Analysis tips
When troubleshooting a wireless LAN, use Wireshark to capture the packets, and analyze the flow of packets to see if you can spot the problem. A wireless 802.1X client device on the wireless network, for example, may appear connected to the wireless network, but the user is not able to access network resources. After reviewing the packet trace, you may see (by observing the VLAN tagging in the appropriate packets), that the client device is connected to the guest network instead of the coroporate network. This would point to a problem with the client’s 802.1X supplicant.
Wireless packet analysis requires a solid understanding of the 802.11 standard and other protocols. Also, some vendors add proprietary functions that may cause confusion when reviewing the flow of packets. Even though this may make life difficult when troubleshooting, concentrate on studying the packet traces captured by WireShark to learn the details of how wireless networks work. Of course this means that you’ll probably need to dig into the guts of the 802.11 standard (and IETF specifications, which define many of the non-802.11 packets).
Wireshark offers tools that could help diagnose problems. After capturing packets, click the Analyze menu and choose Options. A window will appear that may indicate errors, which you can investigate as the possible problem. Similarly, under the Statistics menu, there are several statistical functions that may help pin point the problem.
For more details on using Wireshark, refer to the help function inside Wireshark or review the Wireshark User Guide.
Questions? <<Contact the Author>>
Back to Tutorials
