HOME
Consulting Services
Management ConsultingProduct Development
System Implementation
Wireless Site Surveys
Troubleshooting
Training
Expert Witness
What's New
Technical Resources
NewsletterBooks
Tutorials
Industry News
Quick Tips
Links
About Us
ConsultantsTechnology Focus
Industries Served
Our Clients
Client Testimonials
Contact Us
Follow Us:
How to: Assess RF Interference with a Spectrum Analyzer
by
Jim Geier
Back to Tutorials
RF interference is an unwanted “signal” that occurs at the same time and frequency as a data signal. Interference to wireless networks may come from a variety of sources, such as a microwave oven (MWO), cordless phone, or Bluetooth device. Most RF interference occurs in the 2.4 GHz band; whereas, the 5 GHz band is still relatively unaffected.
The problem with RF interference is that it causes wireless receivers to sporadically make mistakes when decoding packets, which results in retransmissions of data. This disrupts the flow of data and degrades quality-of-service. For example, when significant interference occurs, users of wireless IP phones may likely experience dropped calls, and browsing the web may be very slow.
Spectrum analyzer basics
A spectrum analyzer, available from vendors such as AirMagnet, Bantam Instruments, BVS, and MetaGeek, is a crucial tool for assessing RF interference because it visualizes RF signals. The display of a spectrum analyzer shows the amplitude (usually in dBm) of all signals over a particular range of frequencies, such as 2.4 GHz to 2.5 GHz, the “2.4 GHz band” used by 802.11b/g/n networks. The displayed amplitudes represent a combination of signals coming from data traffic on wireless networks and interfering signals coming from other sources.
Spectrum analyzers have multiple methods for displaying signal amplitudes. Normal mode is generally when the analyzer displays amplitudes that change quickly in step with the actual signal as the signal changes. This is a measurement of what’s actually happening in the spectrum.
Most spectrum analyzers also have what’s referred to as peak mode, which is when the analyzer continuously displays the maximum amplitudes of what the signals reached across a selected range of frequencies. This is useful for creating a record of the highest signal values without needing to watch the analyzer screen for an extended period of time. Don’t be alarmed, though, if the maximum values eventually show high signal amplitudes. If the interfering signals that caused the high peak values aren’t present very often, the resulting impact on the wireless network will likely not be significant.
A spectrum analyzer mode that is very useful is quasi-peak mode (some analyzer vendors may use different names for this mode). Quasi-peak is similar to peak mode, except instead of continuously displaying the highest signal values, quasi-peak allows the signal amplitudes at each frequency to decrease (“discharge”) at a particular rate if the signal goes away. A full discharge occurs typically within a few seconds, and sometimes this rate is adjustable. As a result, quasi-peak mode indicates the “annoyance” factor of the interference. An interfering signal that occurs often (which means it’s harmful) causes the analyzer to display relatively constant amplitudes that you can easily see in the display.
Recording spectrum images
You should record and analyze spectrum images for each source of RF interference to determine its impact on the wireless network. Before cranking up a spectrum analyzer, however, fully understand what RF devices are currently in use and any issues users may be having when utilizing the wireless network. Tour the facility, and look for potential interfering sources, such as MWOs, cordless phones, and Bluetooth devices. Also, talk to people in the facility, and question them on how often they use these devices. All of this will help you understand what to focus on.
Use the spectrum analyzer to record several spectrum traces at different distances within 50 feet of potential sources of interference. You’ll need to operate these devices so that their signals will appear in the spectrum image. For example, heat a glass of water in a MWO or place a call on a cordless phone while recording the spectrum images. Be sure to record the spectrum image where users will likely utilize the wireless network. If you’re performing a wireless site survey, also record a spectrum image every 100 feet or so on each floor of the facility during times when general sources of interference (e.g., cordless phones) are most active. This will provide a general idea of what the spectrum looks like throughout the facility, in addition to testing specific areas where potential sources of interference reside. Don’t forget to note where each spectrum image was recorded.
If possible, turn off the wireless network before taking readings with a spectrum analyzer so that the analyzer only displays the amplitudes of potentially interfering signals. That way the RF signals that the wireless network emits will stay out of the way when you’re analyzing the interference.
Determine impacts of interfering signals
Look through the spectrum images, and note the ones that may impact the performance of the wireless network. As a rule of thumb, assume that there’s a high probability of significant RF interference if the spectrum analyzer displays constant amplitudes greater than -80 dBm or spikes greater than -70 dBm occurring more than once every couple seconds or so (resulting from an interfering source, and not your wireless network). This assumes of course that the interfering signal amplitudes are occurring within the part of RF spectrum that your wireless network operates. If the interference is present only in the upper part of the 2.4 GHz band, for example, and the access point is operating on channel 1 (i.e., lower part of the band) in the same geographical area where the interference is present, there will likely be no impacts from the interference. Also, lower signal amplitudes or spikes occurring less often than what’s described above will not generally pose problems to a wireless network.
If you see an indication of potential RF interference in the spectrum images, you should conduct performance testing with the wireless network to better understand the resulting impacts. This could entail running throughput tests or using the wireless applications (e.g., wireless IP phone) in applicable areas with and without the interfering source present. Be certain to set the access point that’s closest to the test area to a channel that falls within the same part of the band where the interference is present. This ensures that the testing gives an indication of worst-case performance degradation. If the RF interference is present across the entire band, then it doesn’t matter which channel the network is tuned to for testing. After getting some practice, you may become proficient enough at observing the spectrum images and determining the resulting performance impacts without conducting any performance testing.
With the performance test data, you can decide whether the interference is significant. A 20 to 30 percent drop in throughput resulting from the interference may be acceptable for some applications, but it may be unacceptable for an active wireless network. Also, some applications, such as wireless IP phones, are fairly sensitive to retransmissions caused by interference and may fail to operate adequately even with slight drops in throughput due to the interference.
Keep in mind that an interfering source must be operating for it to impact network performance. You may find that a MWO totally pollutes the spectrum and causes a substantial drop in performance in the general facility of the MWO, but that may be acceptable if the MWO is only used once or twice a week or there aren’t any “critical” wireless users within 30 feet or so of the MWO.
For tips on resolving RF interference that you might find, refer to my previous tutorial on minimizing RF interference issues.
Example spectrum images
The following sections include spectrum images (2.4 GHz to 2.5 GHz) corresponding to various types of RF interference and describes resulting impacts on the performance of a 2.4 GHz (802.11g) wireless network. All spectrum images were recorded in quasi-peak mode with all wireless networks and other sources of RF interference in the area turned off. In each of the cases, the 5.0 GHz to 6.0 GHz band was found to be relatively quiet. Throughput testing was done in areas where signal coverage of the wireless network (tuned to channel 1) was very good with SNR of 30 dB or higher.
MWO Interference
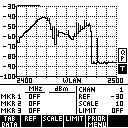
This spectrum image was recorded with a MWO operating ten feet away. With signal amplitude consistently ranging from -60 dBm to -40 dBm across the majority of the band, this particular MWO (1,200 watt, Sharp R-320HQ) produces substantial RF interference to 2.4 GHz wireless networks. The performance degradation depends on the distance from the MWO, but at ten feet, this MWO causes 30 percent lower throughput than normal. At two to three feet, the throughput drop is 90 percent.
2.4 GHz Cordless Phone Interference
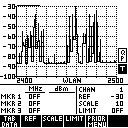
This spectrum image was recorded two feet from a 2.4 GHz cordless phone while conducting a telephone call. The interfering signals from this cordless phone (AT&T) are high amplitude spikes occurring over large portions of the band, which produces moderate interference to 2.4 GHz wireless networks. This phone causes 10 percent lower throughput than normal in the immediate area when the phone is in operation.
Bluetooth Interference
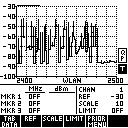
This spectrum image was recorded with a Bluetooth headset operating two feet away and interfacing with a Blackberry Bold while conducting a telephone call. The interfering signals are high amplitude spikes occurring over the majority of the band (characteristic of FHSS modulation), which produces significant interference to 2.4 GHz wireless networks. This configuration causes 20 percent lower throughput than normal in the immediate area where the phone is in operation. There is no significant interference when the Bluetooth headset is not placing a call with the Blackberry phone, even though the headset and phone are actively paired via Bluetooth.
Concluding points
Keep in mind that the examples shown above are based on specific devices, and other models may offer differing results. As a result, be certain to test your actual network environment to provide the most accurate basis for assessing impacts of RF interference on your wireless network.
Questions? <<Contact the Author>>
Back to Tutorials